
Interpreting Experiment Results
It's possible you're already familiar with experimentation results. If so, feel free to skip this lesson. Otherwise, let's talk about the results that LaunchDarkly provides.
You may remember that you selected a Baseline variation when you added the Score metric to the experiment:
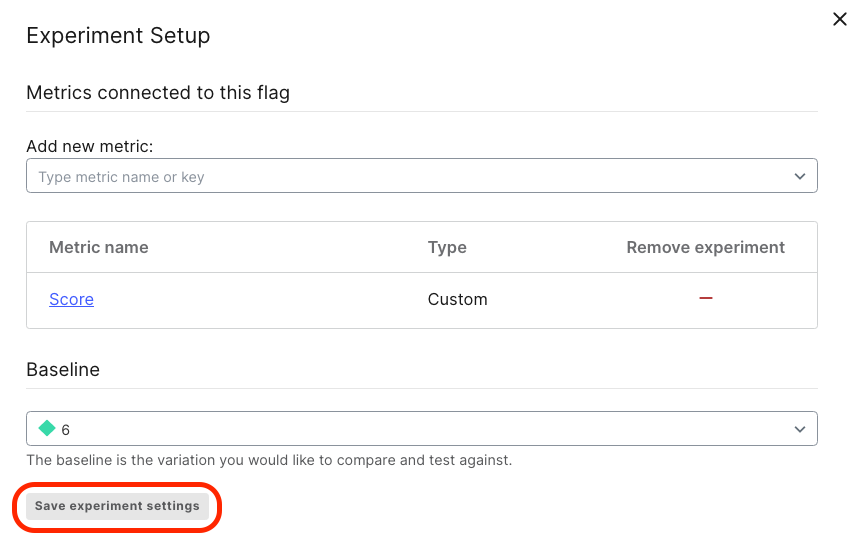
When you run an experiment in LaunchDarkly, the results shown are all relative to the baseline. Remember, when we configured our metric, we determined that the higher speed variations should be Lower than the baseline.
Once your experiment has started, LaunchDarkly runs a Statistical test under the hood. Once we have enough data for our experiment, we'll receive a message on the results page letting us know that our results are Statistically Significant—meaning that the measured differences between the variations are likely due to an actual underlying change in user behavior, rather than random chance.
LaunchDarkly uses two different types of statistical test to report results. Both types of tests are well-known in the field of statistics:
- Experiments measuring Numeric metrics calculate significance using a Two-Tailed T-Test.
- Experiments measuring Conversion metrics calculate significance using a Pearson's Chi-Squared test.
Let's take another look at our simulated results and break down the data in each column:
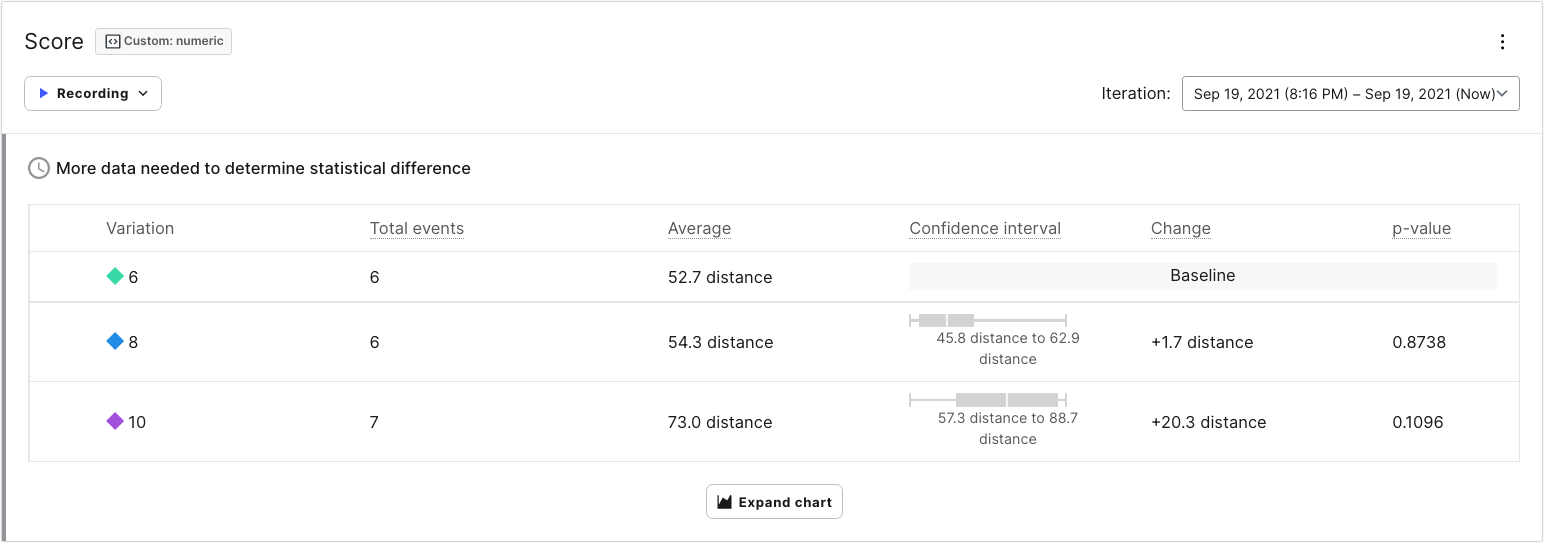
- Variation: This column shows the variation with which the metric data is associated.
- Total Events: The number of events received for that metric. This increments by one each time a user plays a game.
- Average: The average value received for the metric. In this case, it is the average distance that Toggle travels per game for a given variation.
- Confidence Interval: The confidence interval tells us the expected range of values we would receive for a given variation. As your experiment approaches statistical significance, the confidence interval will narrow. Once we reach significance, we can interpret the confidence interval as the actual range of scores we could expect to receive if we implement the associated variation.
- Change: The calculated increase (or decrease) in value compared to the Baseline. Currently, the 8 variation has a lower average distance compared to the baseline, which is why we see a -1.5 change.
- P-Value: The calculated likelihood that the variation is actually impacting users. P-Value is a standard value used in statistics. LaunchDarkly will call an experiment statistically significant when a p-value of .05 or lower is calculated with the given data. A p-value of .05 translates to 95% statistical significance, meaning that there's a 5% chance that our findings are a false positive. In other words, there's no actual difference between the variations. The lower the p-value, the lower the likelihood that results are a false positive.
Continue to the next lesson to learn about how to exclude users from an experiment.